SIR 感染モデル 介入の効果の取り込み -コロナウィルスとの闘い
April 19, 2020 – 10:59 amSIR感染モデルに基づき、新型コロナウィルスの感染拡大をPythonを用いてシミュレートしてみた。シミュレーションでは、感染拡大を緩和するための介入措置がどのような効果を及ぼすかをみてみた。
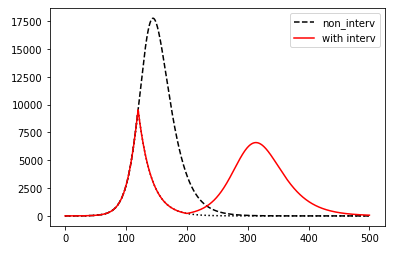
下掲した図は、予測計算の一例。人口100,000人の集団において、ひとりの感染者が発生した時点から時間(日数)推移にともなう感染者数の変化を計算している。縦軸は感染者数。
図示した計算では、感染率 β:1.5(/day)、回復率 γ:0.07(/day) の環境で感染が拡大しているとき、感染者発生から120日目に介入をし、感染率β:0.03とする措置を200日まで(80日間)継続。その後、感染率が元の状態に戻るとした。
介入措置を有効とする期間内では感染者数を下げることはできるが、措置解除後の2波の感染者数の増加を見のがしてはならない。介入は医療システムの維持のための時間かせぎ。結局は、ワクチン、治療薬、あるいは集団免疫が成立するのを待つことになる。
SIR感染モデル:
新型コロナウィルスに限らず伝染病の感染拡大を予測するのにSIR感染モデル(SIR epidemic model)なるものが使われている。
このモデル、ヒト集団を「感染可能者集団(Susceptible)」、「感染者集団(Infectious)」、「回復・抗体取得者集団(Recovered)」の3集団に分け、感染者の発生からの時間経過とともに各々の集団の人数がどのように変化するかを予測する。集団間の移行を感染率 β、回復率 γといったパラメータで表現する。
SIRモデルは、簡単なモデルであるが、伝染病の感染拡大の広がりと回復の予測に広く使われているようである。
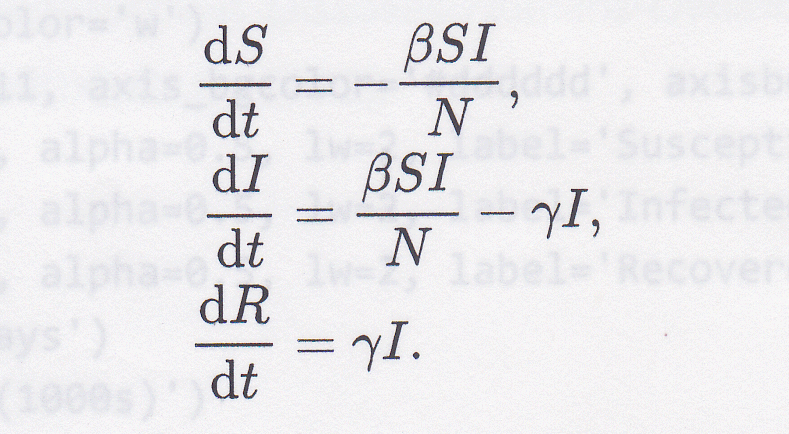
モデルを基礎とする微分方程式:
微分方程式は以下:
- N: 集団トータル(S(t)+I(t)+R(t))
- S(t): 感染可能者数(非感染者)
- I(t): 感染者数
- R(t): 回復者数(死者数を含む)、免疫抗体を獲得、以降感染しない
- β: 感染率(/日)
- γ: 回復率(/日)
Python ソースプログラム:
import numpy as np
from scipy.integrate import odeint
from scipy.optimize import minimize
import matplotlib.pyplot as plt
%matplotlib inline

#differential equation
def pend(y, t, beta, gamma):
    S, I, R = y
    return [-beta * S * I, beta * S * I - gamma * I, gamma * I]

#parameters
#  t_max: endpoint of time for integration (days)
#  dt:    刻み
t_max = 500
dt    = 0.1

t0   = 0
t1_0 = 80
t2_0 = 250

n_t = int(t1_0/dt)
n_t2 = int(t2_0/dt)

# parameters beta, gamma
N_total = 1000
beta  = 0.15/N_total
gamma = 0.1

beta_intv = 0.08/N_total
gamma_intv = 0.1

#initial state
S_0 = 999
I_0 = 1
R_0 = 0

N_total = S_0 + I_0 + R_0
R0 = N_total * beta * (1/gamma)
print(R0)

#fig = plt.figure()
#ax  = fig.add_subplot(1,1,1)

t0   = 0
t = np.arange( t0, t_max, dt)
y0 = [S_0, I_0, R_0]
sol = odeint(pend, y0, t, args=(beta,gamma))
plt.plot(t,sol[:,1],color="black",linestyle="dashed")

t1 = np.arange(t1_0, t_max, dt)
n_t = int(t1_0/dt)
y1 = sol[n_t,:]
sol1 = odeint(pend, y1, t1, args=(beta_intv,gamma_intv))
sol_mod = sol
sol_mod[n_t:,:] = sol1[0:,:]
plt.plot(t,sol_mod[:,1],linestyle="dotted",color="black")

t2 = np.arange(t2_0, t_max, dt)
n_t2 = int(t2_0/dt)
y2 = sol_mod[n_t2,:]
sol2 = odeint(pend, y2, t2, args=(beta,gamma))
sol_mod2 = sol_mod
sol_mod2[n_t2:,:] = sol2[0:,:]
plt.plot(t,sol_mod2[:,1],linestyle="solid",color="red")
#plt.plot(t,sol_mod2)
参考にしたサイト:

