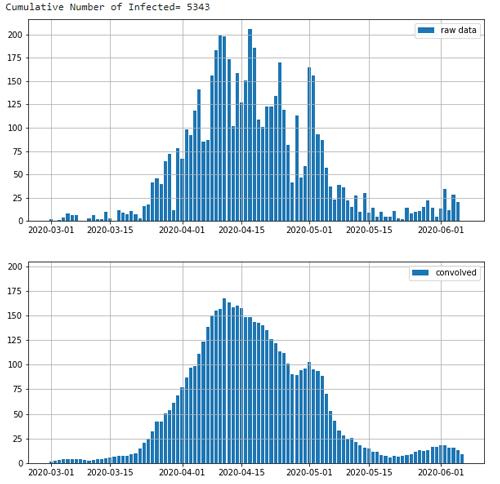
東京都新規感染者日変化と7日移動平均 -コロナウィルスとの闘い
June 6, 2020 – 12:07 pm昨日(6月5日)までの東京都の公開データから新規感染者数の日変化と7日移動平均を上掲した。
上掲図では、3月1日から昨日までの日変化をプロットしている。図の作成は、東京都の公開データ(CSVデータ)からPythonを用いて作成している。Pythonスクリプトのソースを以下に添付している。
なお、図上部に、累積感染者数(Cumulative Number of Infected)として 5,3472人としているが、これは1月24日以降の累積。
Python Script source:
import matplotlib
import matplotlib.pyplot as plt
import pandas as pd
import numpy as np
import datetime

df = pd.read_csv('https://stopcovid19.metro.tokyo.lg.jp/data/130001_tokyo_covid19_patients.csv')

tokyo_df = df[['公表_年月日', '患者_年代', '患者_性別','退院済フラグ']]
tokyo_df.columns = ['date', 'age', 'sex','recv']
tokyo_df_count = tokyo_df['date'].value_counts().sort_index(ascending=True)
df_t = pd.DataFrame(tokyo_df_count)
df_t.columns = ['infected']

dates = pd.date_range('20200124', 'today', freq='D')
df = pd.DataFrame(pd.Series(range(len(dates)), index=dates))
df.columns = ['infected']
for dates in df.index:
    str_date = dates.strftime("%Y-%m-%d")
    try:
        df.infected[str_date] = df_t.infected[str_date]
    except:
        df.infected[str_date] = 0
#str_date='2020-05-28'
#df.infected[str_date] = 15
list_infected = df.infected.to_list()

date_index = [df.index[0].strftime('%Y-%m-%d')]
for i in range(1, len(list_infected)):
    date_index.append(df.index[i].strftime('%Y-%m-%d'))

x = pd.date_range(date_index[0], periods=len(date_index),freq='d')
y = np.array(list_infected)
y_cum = np.cumsum(y)
print('Cumulative Number of Infected= ' + str(y_cum[len(y_cum)-1]))

start_date = '2020-03-01'
i_start = df.index.get_loc(start_date)

num = 7
b = np.ones(num)/num
y2 = np.convolve(y, b, mode='same')

fig = plt.figure(figsize=(10,10))

x_d = x[i_start:]
y_o = y[i_start:]
y2_o= y2[i_start:]

ax = fig.add_subplot(2,1,1)
#ax = fig.add_axes([0,0,1,1])
ax.bar(x_d, y_o,label='raw data')
#ax.bar(x, y_cum,label='raw data')
ax.legend()
ax.grid()

ax = fig.add_subplot(2,1,2)
#ax = fig.add_axes([0,0,1,1])
ax.bar(x_d, y2_o, label='convolved')
ax.legend()
ax.grid()

plt.ylim(0, 205)
plt.show()
